
Explain every slowdown, with evidence.
DB time breakdown, plan and index analysis, object dependencies and backup visibility — on one platform.
The problems it solves
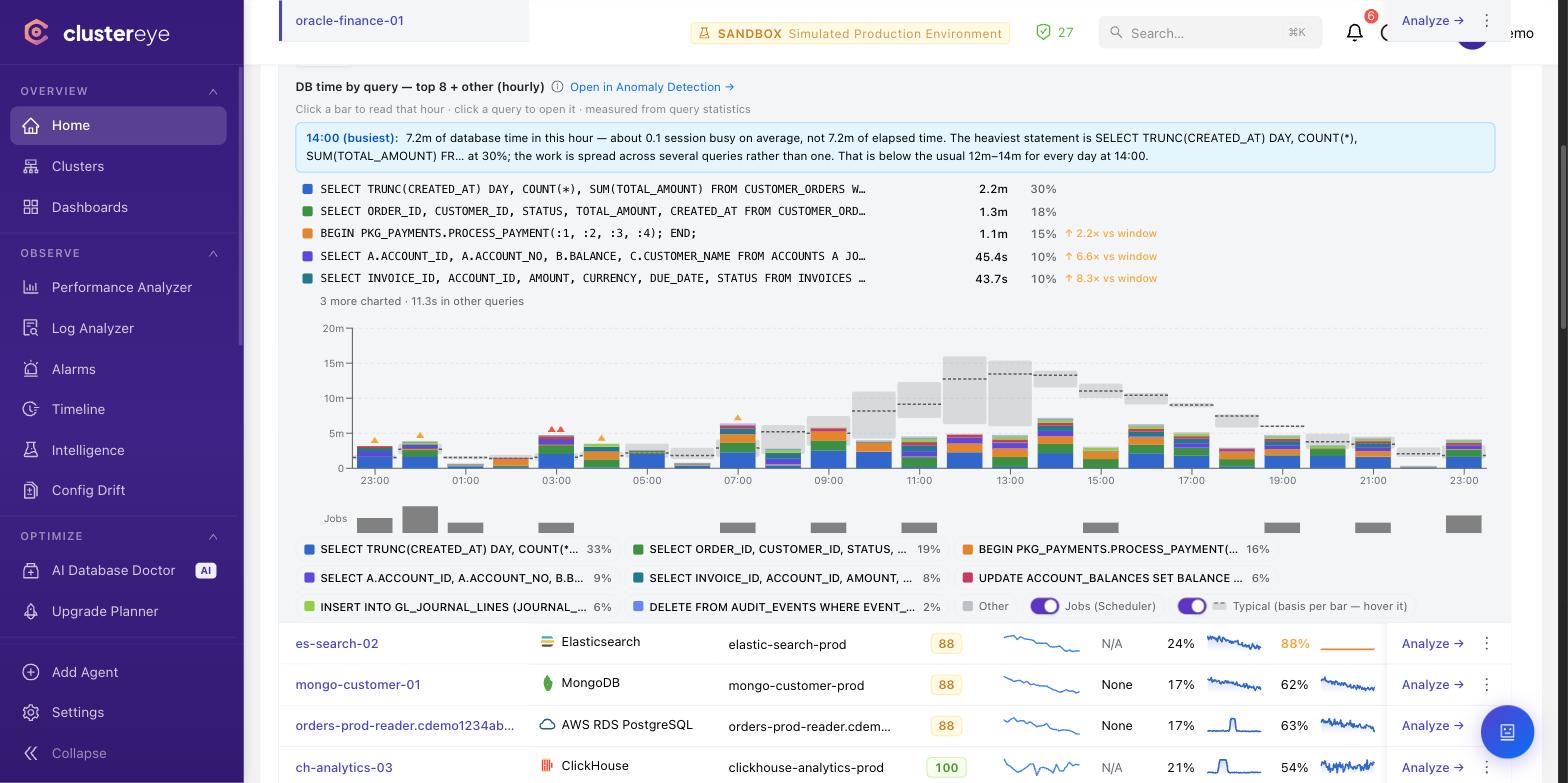
Which query is spending database time?
Performance →Which index is missing, and what would it change?
Query intelligence →Nobody knows which queries depend on a table before it changes.
Dependency graph →The features that do it
Wait events & query performance
Sample active sessions every 5–15s (1s on demand) and see which query, user or host is spending database time — drill in with one click.
- DB time by query, wait, database, user, program, host
- 30 days of detail, 400 days of hourly DB time
AI-driven query optimization
Catching slow queries isn't enough — ClusterEye explains them automatically, analyzes plans, and produces index suggestions — validated with HypoPG on PostgreSQL.
- EXPLAIN plan visualization + cost analysis
- Index and statistics suggestions (PostgreSQL, MongoDB, MSSQL)
- Pattern-based aggregation via query fingerprints
What breaks if I touch this table?
The Database Context Graph continuously maps the tracked statements to the objects they touch. Open a table and you see the queries that read and write it, each one's load over the last 24 hours and how it reaches the data — a seek or a full scan — so "who still uses this?" is answered before a schema change, not guessed. It reads the other way too: from a statement down to the tables, indexes and plans it depends on.
- Object impact: "Dropping this table affects 10 queries — 4 write to it", as a diagram or a table
- Honest edges: reads and writes are separated, and an edge says whether it came from an execution plan or was inferred from the query text; historical dependencies are marked as such
- Query to object: a statement's waits, plans, the tables it touches and its neighbouring statements, in one drawer
- PostgreSQL, SQL Server, Oracle, MySQL, ClickHouse and MongoDB
- A "what the graph can't know" section names what is missing: untracked statements, and code that has not run yet
Backup visibility and restore drills
See backup history for SQL Server, Oracle RMAN and PostgreSQL WAL archiving; on Fleet-managed PostgreSQL, scheduled restore drills prove the backup restores.
- Scheduled restore drills to a separate host (PostgreSQL/pgBackRest)
- Point-in-time restore for Fleet PostgreSQL
- MSSQL, Oracle RMAN and WAL archive health
See it in your team's environment.
A demo with your engines and your questions.