What we read
SHOW GLOBAL STATUS and SHOW GLOBAL VARIABLES — throughput, connections and configuration state
performance_schema.events_statements_summary_by_digest — per-digest timing and call statistics
SHOW ENGINE INNODB STATUS — buffer pool, row locks and the most recent deadlock
performance_schema.data_locks and data_lock_waits — lock wait chains
SHOW REPLICA STATUS and replication_applier_status_by_worker — replication lag and parallel applier state
SHOW PROCESSLIST — active sessions and long-running queries
table_io_waits_summary_by_index_usage — index usage and unused index detection
performance_schema.error_log — error log records (MySQL 8.0+)
What it does specifically for MySQL
Digest-based query analysis
Queries are grouped by performance_schema digest and prioritised by total time, call count and rows-examined ratio. Grant SELECT on your application schema and Safe EXPLAIN adds the plan too.
InnoDB pressure indicators
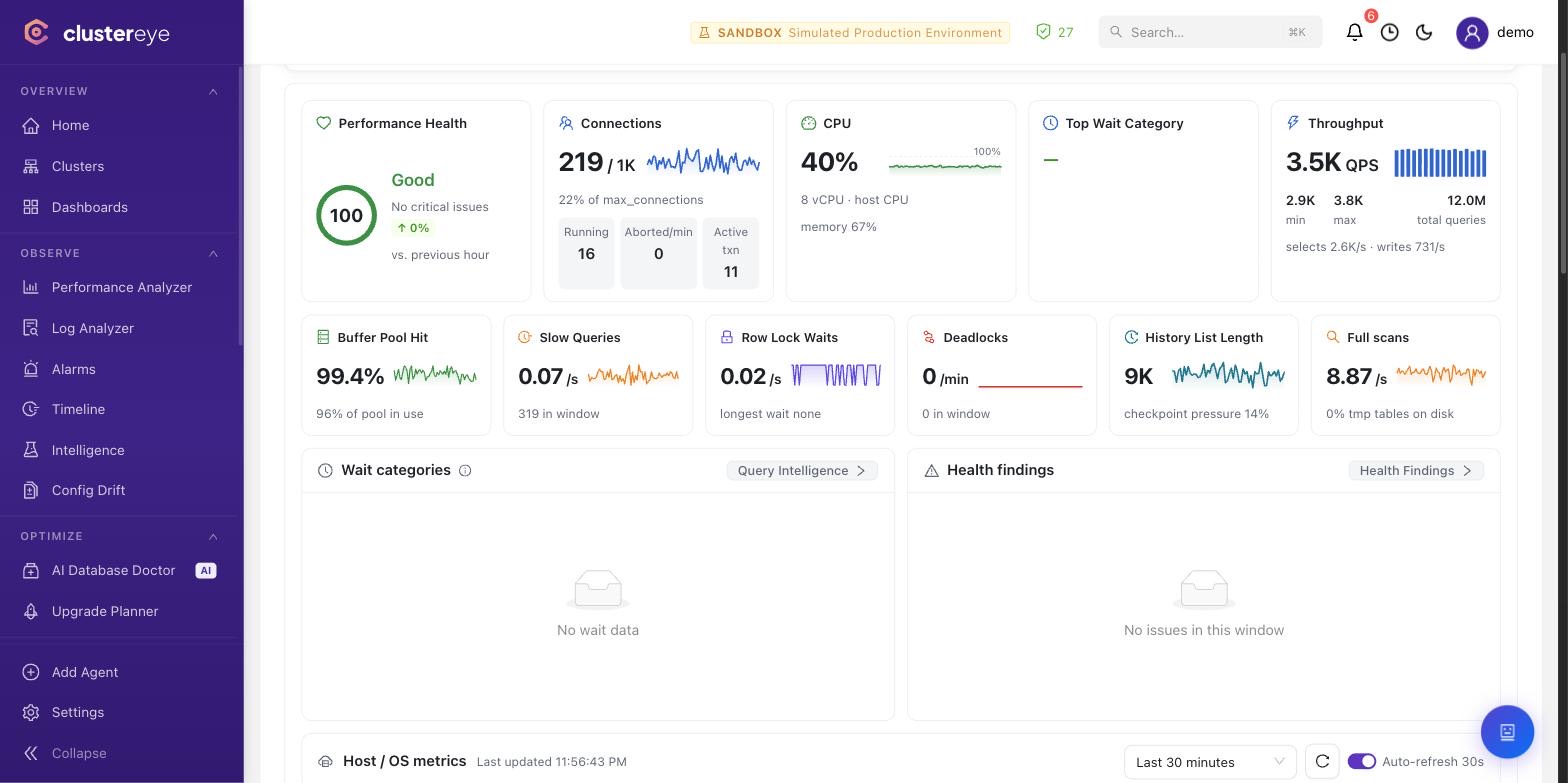
Buffer pool hit ratio, dirty page ratio, row lock waits and deadlock counts are tracked together, so it is visible when write pressure turns into a locking problem.
Replication tracking
Replica lag, applier thread state and disconnect events are tracked; on multi-worker setups it identifies which worker is falling behind.
Minimum privileges required
The baseline is read-only and safe to grant in production.
Prerequisites
·my.cnf: performance_schema = ON (not dynamic, restart required)
·No separate grant is needed for information_schema
·SUPER or SYSTEM_VARIABLES_ADMIN are not required