Observability DBAs love and SREs trust
Dashboards, alerts, automation — all from one source of truth.
Cluster topology
See primaries, replicas, arbiters and shards on a live map. Catch failovers in seconds.
Query intelligence
Find slow queries automatically. Get AI-driven index suggestions and plan analysis.
Smart alerts
Replication lag, disk I/O, deadlocks — learn anomalies and reduce noise by 80%.
Backup verification
Continuously test your backup health. Prove your RPO/RTO targets with real data.
Operations Timeline
Every event in your environment on one timeline. Correlation-based incident grouping with root-cause hints.
Database activity monitoring
Every change on Oracle and MSSQL on the record with a risk score: who changed what, from where, with which program.
Database Fleet
Provision, scale and upgrade PostgreSQL, MongoDB and MySQL clusters on your own servers. Each one is monitored the moment it is built.
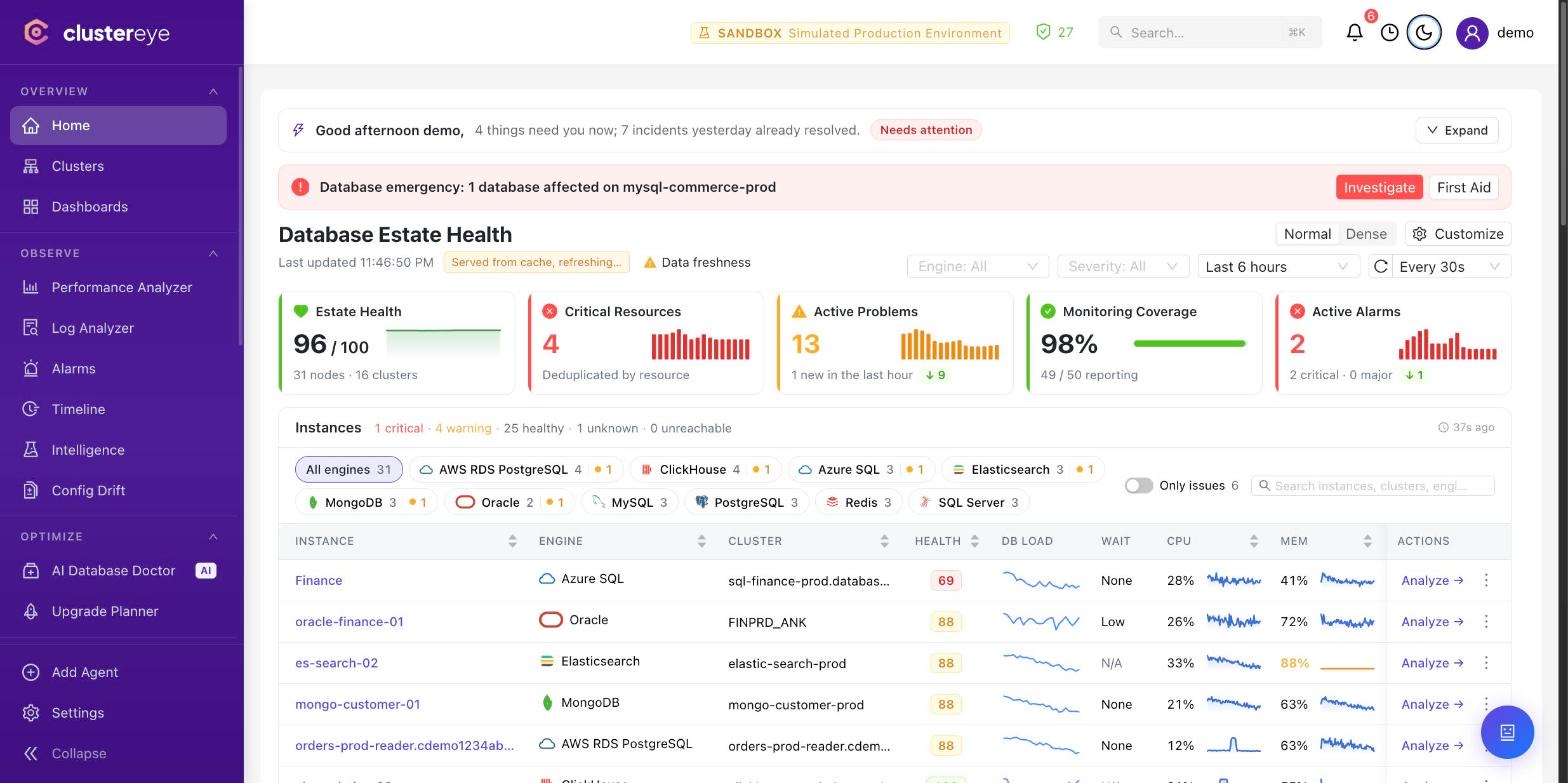
Stay in the flow
Walk through a live dashboard: cluster health, query load, replication lag.
Production-ready, on-prem & cloud-native
Low-overhead agent, collector in your own VPC, export anywhere — all on open standards.
Live in three steps
Install the agent
One-line command. Linux, Windows, Kubernetes, Docker — runs everywhere.
Map your cluster
ClusterEye auto-discovers primary/replica topology and draws it for you.
Watch and act
Dashboards light up. Alerts ready out-of-the-box. Slack & PagerDuty wired in.
Simple, scales as you grow
Start free, pay as you get value.
Starter
For small teams
Advanced
Growing teams
14-day free trialEnterprise
High-scale & compliance
Talk to sales