See what is happening
Topology, performance and the event stream — the environment as it is now, and over the last 30 days.
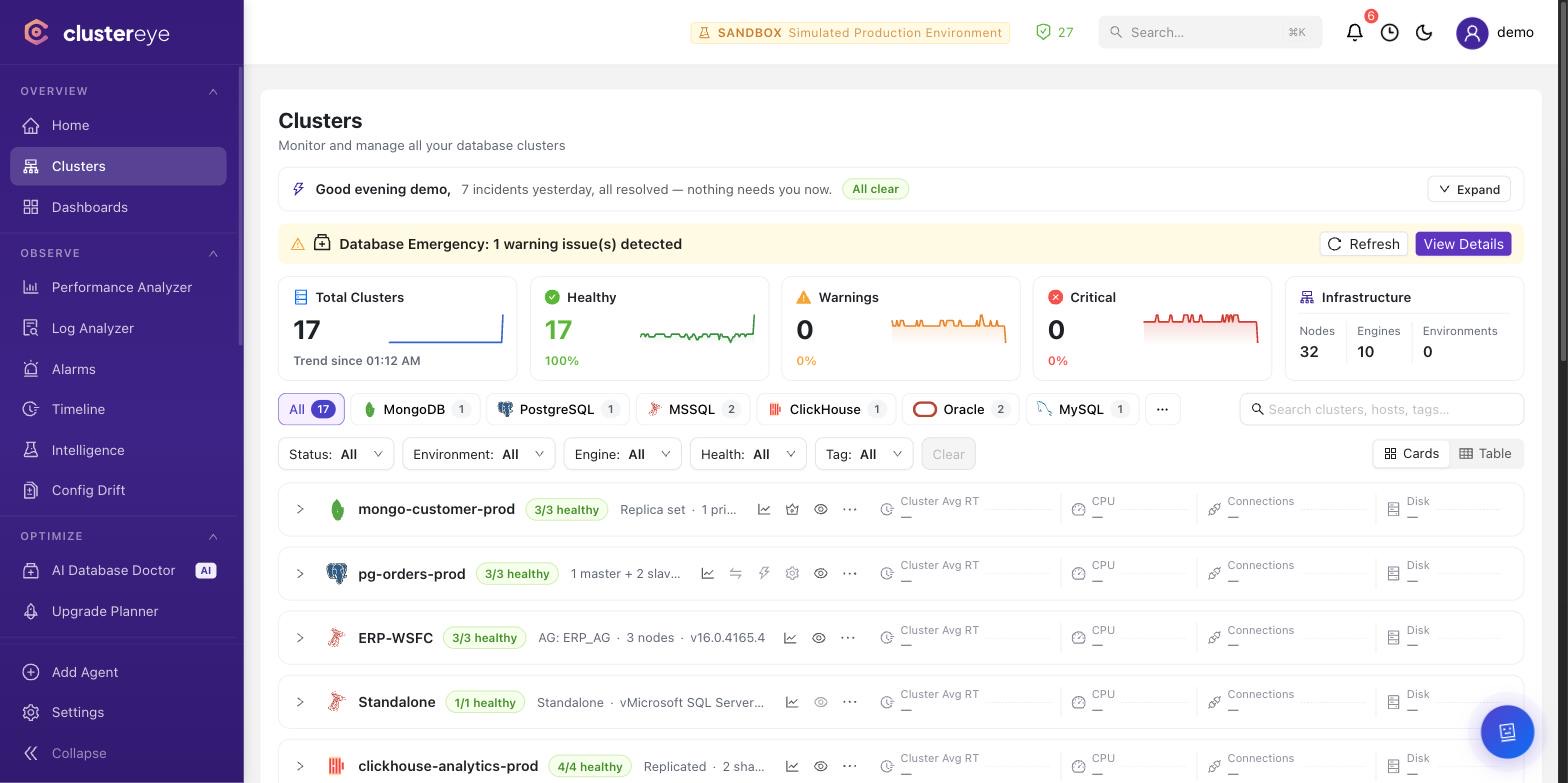
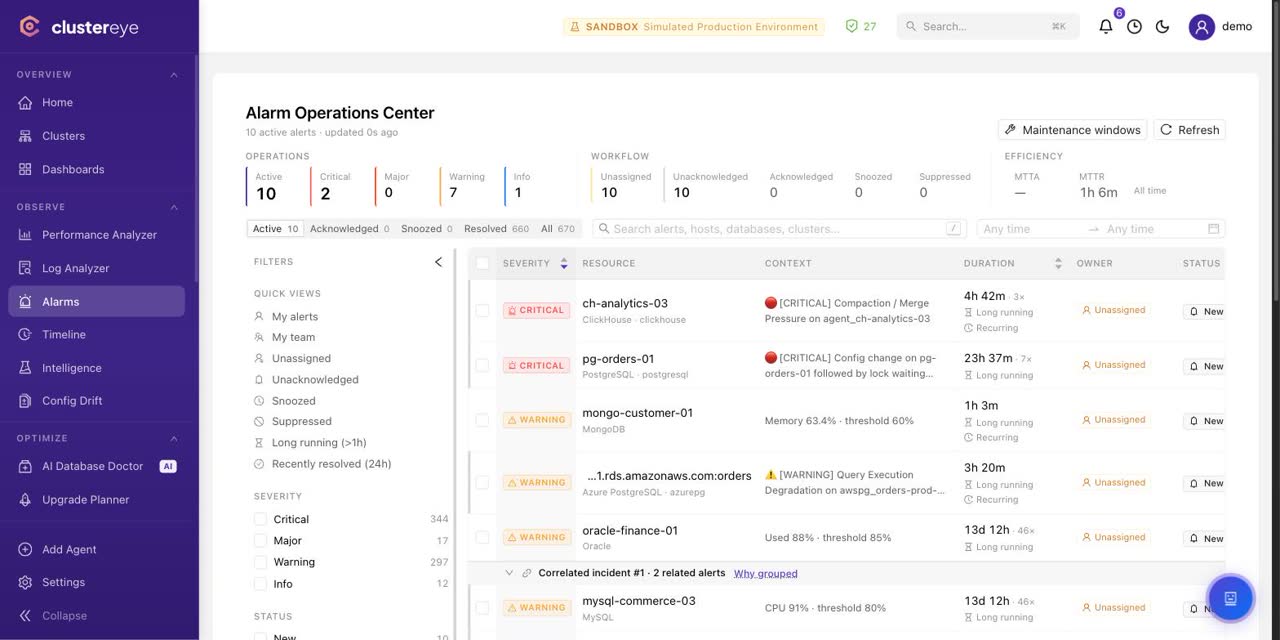
See your cluster topology, live
Watch primaries, replicas, arbiters and shards on a real-time map. Catch failovers instantly and rebuild replication chains in seconds.
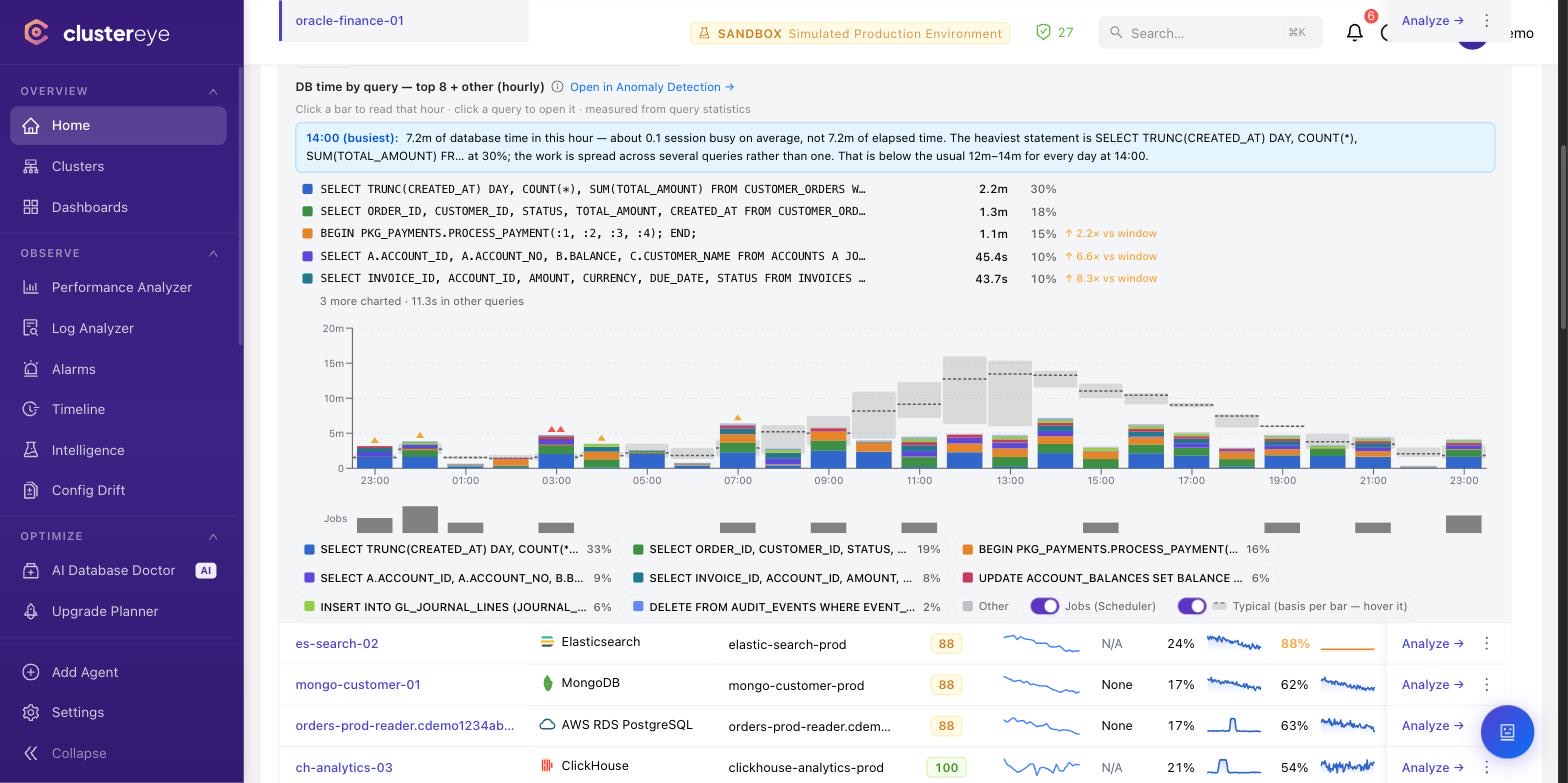
Wait events & query performance
Track IO, lock, and CPU wait events at second granularity. Which query, which user, which host slowed down — drill in with one click.
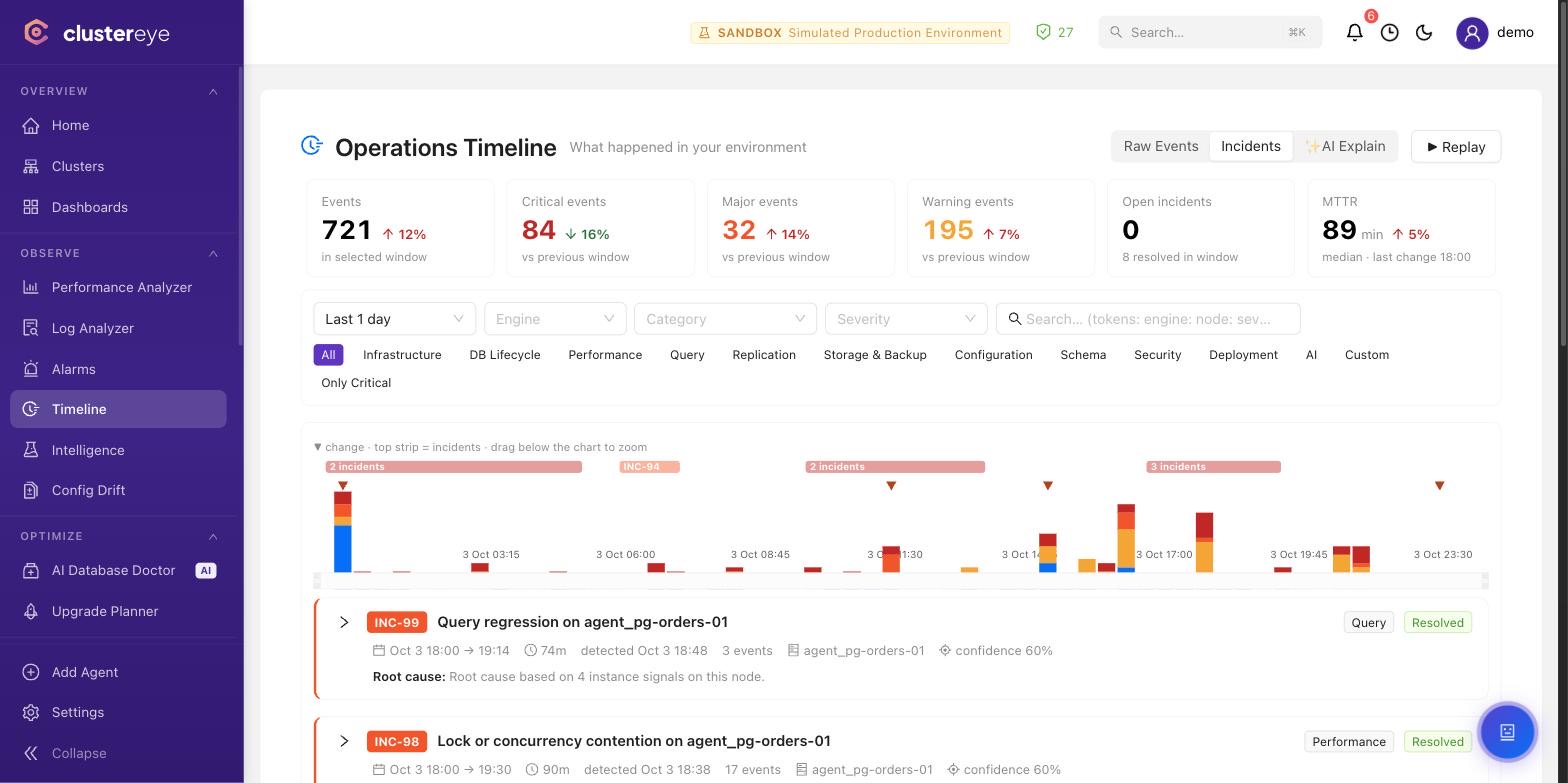
Operations Timeline — what happened in your environment?
Alarms, metric anomalies, configuration changes, deployments and schema activity flow into a single timeline. The correlation engine automatically groups related events into incidents and flags the likely root cause — answering "what happened last night?" takes seconds, not minutes.
Find out why
Anomaly detection, query intelligence and the dependency graph: the path from an alert to a root cause.
AI-driven query optimization
Catching slow queries isn't enough — ClusterEye explains them automatically, analyzes plans, and produces verified index suggestions.
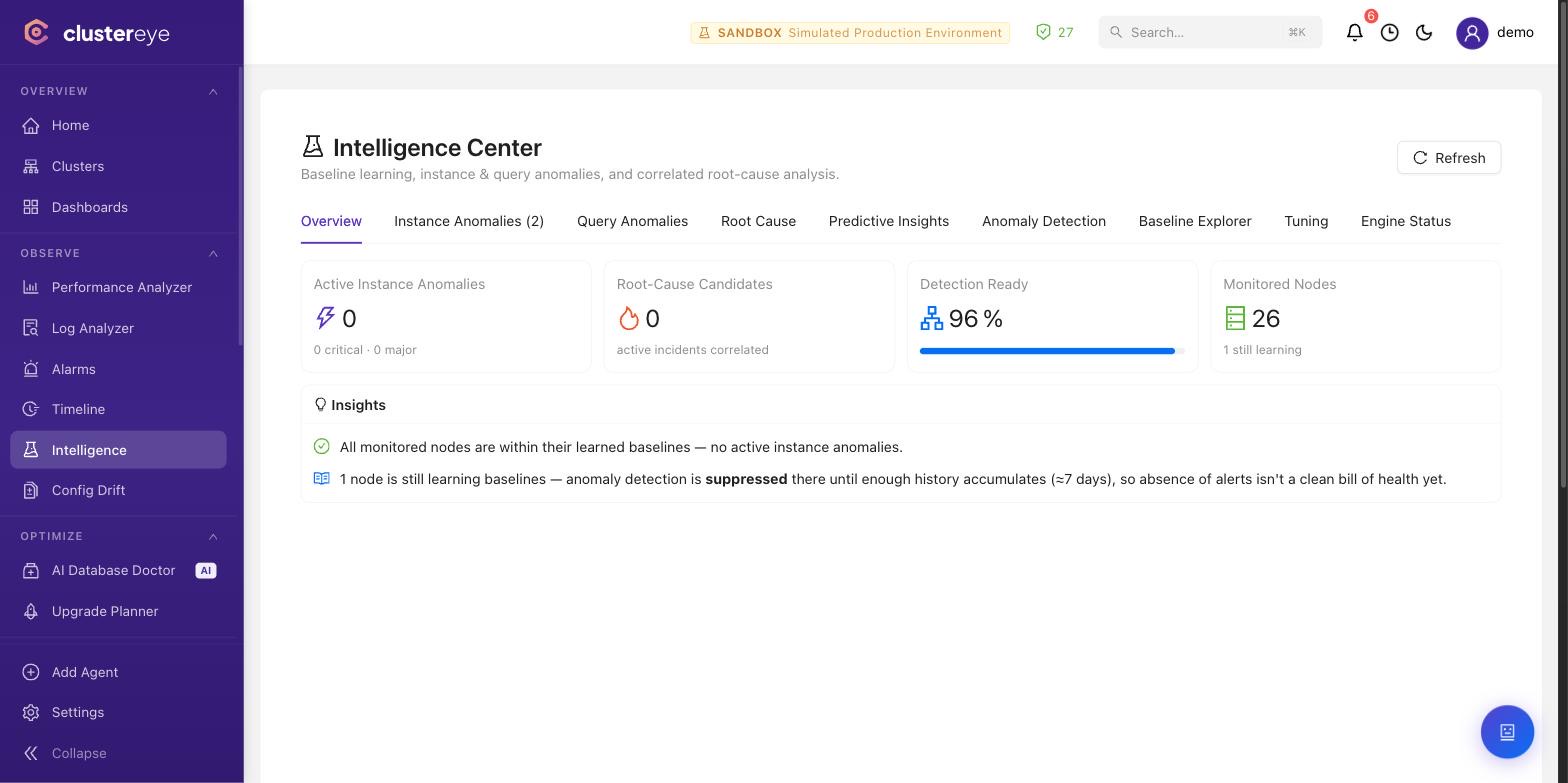
Noise-free, anomaly-based alerts
Static thresholds are dead. ClusterEye learns your normal — replication lag, deadlocks, disk I/O — and pages you only when it actually matters.
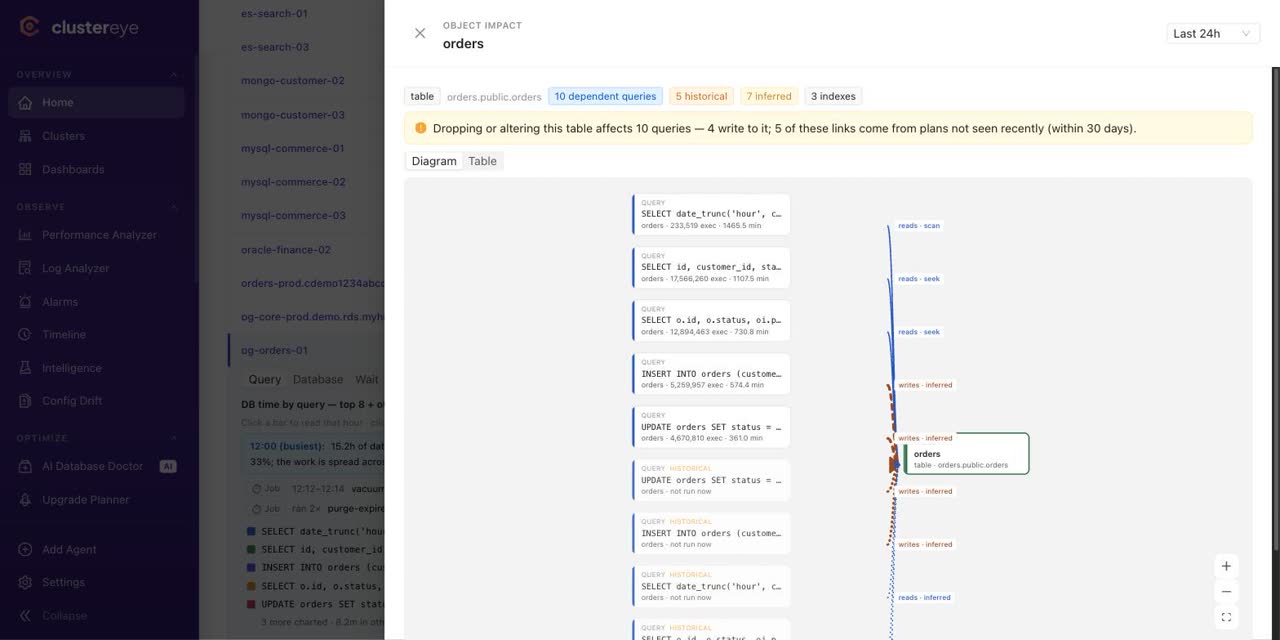
What breaks if I touch this table?
The Database Context Graph continuously maps running statements to the objects they touch. Open a table and you see the queries that read and write it, each one's load over the last 24 hours and how it reaches the data — a seek or a full scan — so "who still uses this?" is answered before a schema change, not guessed. It reads the other way too: from a statement down to the tables, indexes and plans it depends on.
Protect the data and the audit trail
Prove the backup actually restores, and keep a record of who changed what.
Prove your backup health with real data
Knowing you took a backup isn't enough — ClusterEye runs automated restore tests and accumulates evidence against your RPO/RTO targets.
Security audit for compliance
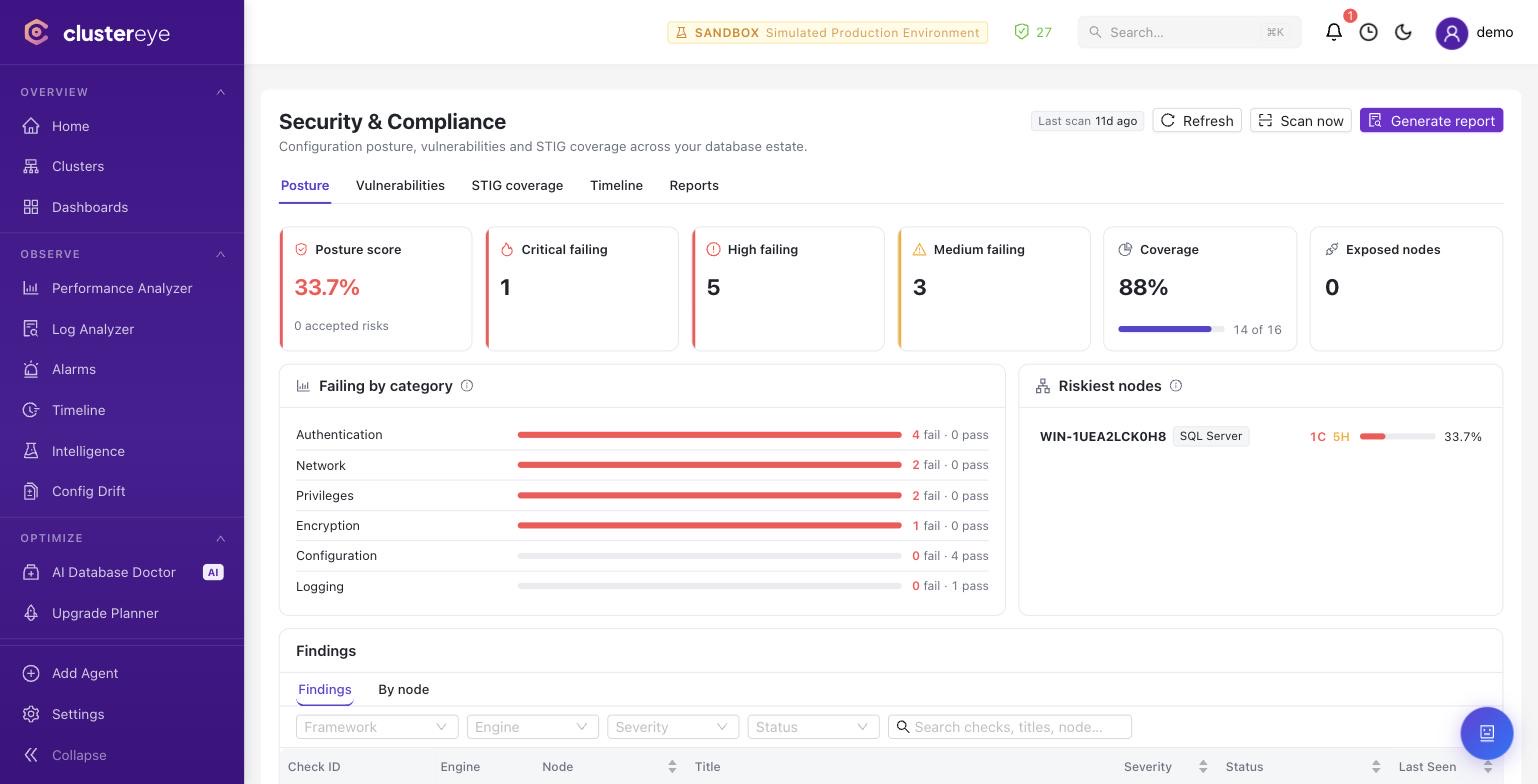
Continuously scan for unauthorized access, open ports, critical CVEs, and weak password policies. Out-of-the-box reports for SOC 2, ISO 27001, GDPR and PCI-DSS.
Activity monitoring: who changed what, from where?
The Audit Investigation Center scores Oracle and MSSQL activity by risk in one audit trail: bulk deletes, after-hours activity, shared service accounts and failed statements surface instantly. On Oracle the source is Unified Auditing; on MSSQL the traffic is captured off the network — without connecting to the database, without turning on Extended Events or a trace, and without measurable load on the server.
Provision and keep alive
Beyond monitoring: standing clusters up and running them for their whole life.
Database Fleet — provision the database, then keep it alive
The part of ClusterEye that is not monitoring: it provisions PostgreSQL (Patroni HA, streaming replication), MongoDB (replica sets, sharded clusters) and MySQL (InnoDB Cluster) onto your own servers, then operates them — adding and removing members and shards, rolling upgrades, switchovers, credential rotation and pgBackRest backups. Every operation runs through a state machine from preflight to validation, and a failed step rolls the completed ones back automatically. The last provisioning step installs the agent, so a cluster is monitored from the moment it exists.
What you have, and what it costs
Find the databases in your cloud and on your network, then measure their capacity and their bill.
Every database in your cloud account, in one list
Cloud Estate scans the cloud accounts you connect, read-only, and inventories their managed database services. Its real value is answering one question: which of these is nobody monitoring? Coverage gaps, publicly reachable instances and recent changes are each called out.
Find the databases that never made it into the inventory
Nobody can honestly claim to know every database they run. Network Discovery scans the IP ranges you give it, fingerprints the services on open ports at the protocol level to tell which engine they are, and separates the managed from the unmanaged. It works without credentials; give it credentials and the version becomes exact.
Reclaim over-allocated capacity, with the measurement to back it
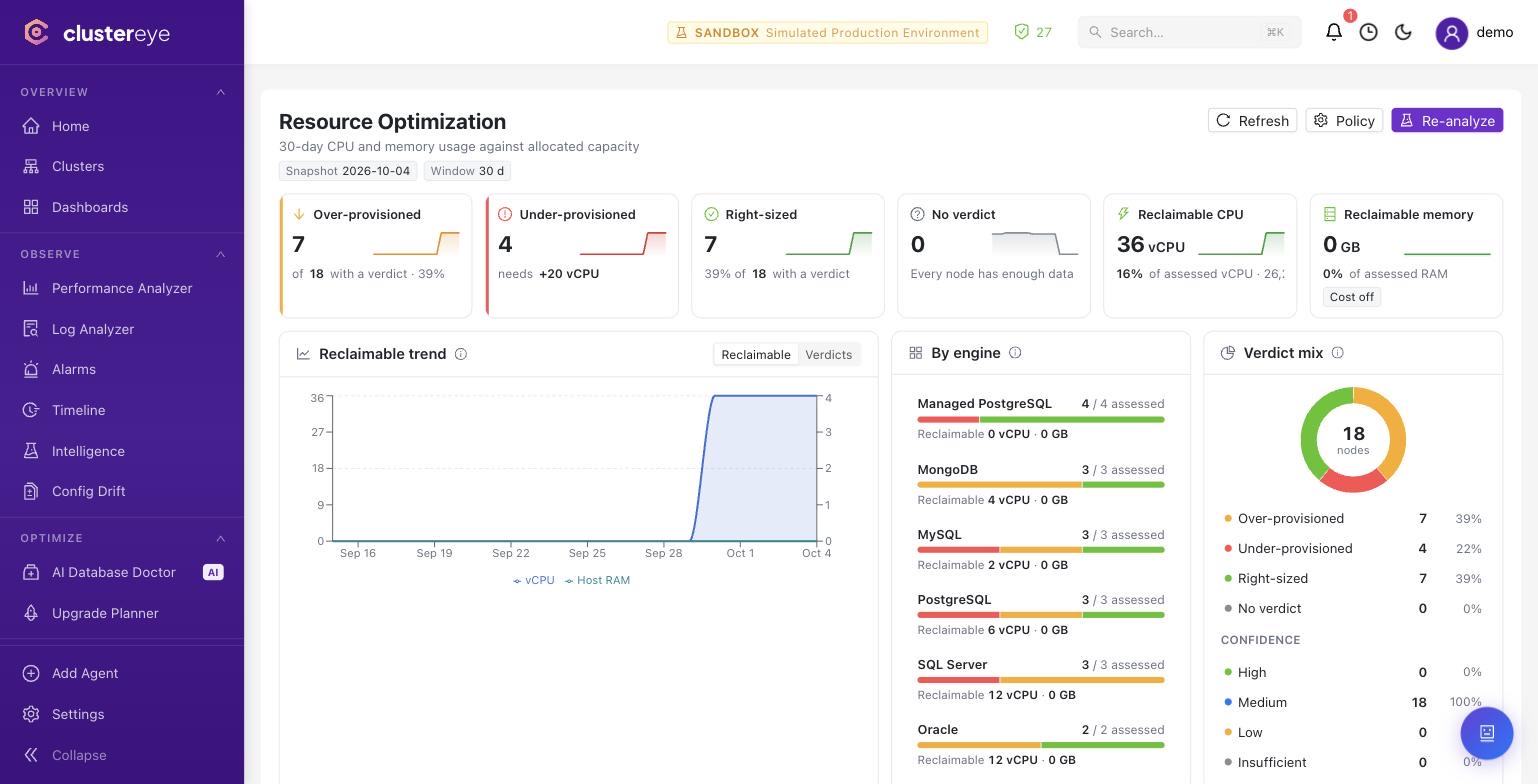
Thirty days of CPU and memory usage are compared against allocated capacity. Every node gets a verdict — over-provisioned, right-sized or under-provisioned — and the verdict carries a confidence. Nodes that are new or short on history are marked as still learning rather than guessed at.
What your managed databases actually cost
Cost Intelligence reads your cloud bill and breaks the cost down to the individual database. Instead of the service totals a cloud console shows, you get the answer to "what did this cluster cost this month" — and read next to the right-sizing verdicts, it puts a number on the capacity you could reclaim.