← All databases
PG

PostgreSQL monitoring

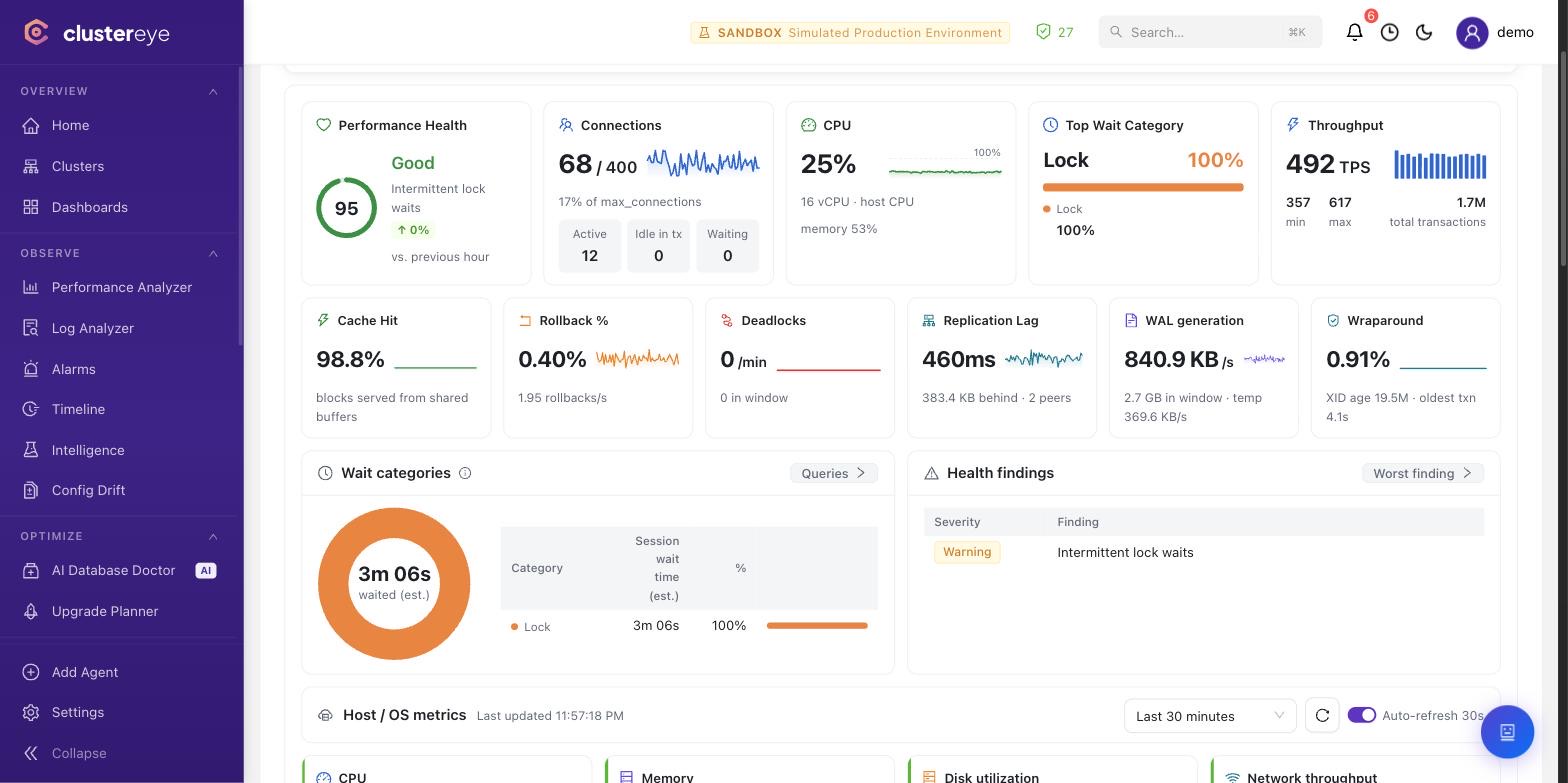
ClusterEye monitors PostgreSQL through an agent that runs on the database host. The agent connects with a read-only account (the pg_monitor role) and collects PostgreSQL-specific signals — replication lag, autovacuum behaviour, query plans, table bloat — then lines them up on the same timeline as host CPU, memory and disk I/O. Supported versions: PostgreSQL 9.6 — 17.

Agent-basedDefault port: 5432Versions: 9.6 — 17
PostgreSQL — ClusterEye Performance Analyzer

What we read

pg_stat_activity — active sessions, longest running transaction, blocked queries
pg_stat_replication, pg_replication_slots, pg_stat_wal_receiver — replication lag, slot retention, standby state
pg_stat_statements — per-query calls, total and mean time, I/O breakdown
pg_stat_user_tables / user_indexes — dead tuple accumulation, last vacuum/analyze, unused indexes
pg_locks — blocked queries and lock wait chains
pg_stat_archiver, WAL LSN functions, pg_ls_waldir() — archiving health and WAL generation rate
pgstattuple / pgstatindex — table and index bloat (as a daily job)
postgresql.conf, postgresql.auto.conf and pg_hba.conf — configuration drift

What it does specifically for PostgreSQL

Tuning Advisor

Measures your actual workload and produces justified recommendations for parameters such as shared_buffers, work_mem and effective_cache_size. Applying them is approval-gated and done through ALTER SYSTEM plus a reload; changes that need a restart are flagged separately.

Missing index advice, validated hypothetically

Index candidates are derived from slow queries and their effect on the plan is verified with HypoPG — without creating the index. The recommendation rests on a measurement, not a guess.

Autovacuum and bloat tracking

Dead tuple ratio, last vacuum time and distance to transaction ID wraparound are tracked, so bloat is flagged before it becomes an incident.

Replication and failover visibility

Streaming and logical replication chains are drawn on a live map; slot retention, standby disconnects and promotion events are recorded historically.

Minimum privileges required

The baseline is read-only and safe to grant in production.

sql
CREATE ROLE clustereye LOGIN PASSWORD '<strong-password>';

-- pg_monitor = pg_read_all_settings + pg_read_all_stats + pg_stat_scan_tables
GRANT pg_monitor TO clustereye;

-- repeat for every monitored database
GRANT CONNECT ON DATABASE <db> TO clustereye;

-- pg_hba.conf: allow clustereye from the agent host (scram-sha-256)

Prerequisites

·shared_preload_libraries = 'pg_stat_statements' (restart required) — for query intelligence
·CREATE EXTENSION pg_stat_statements; — top queries / query analysis
·CREATE EXTENSION pgstattuple; + GRANT EXECUTE ON FUNCTION pgstattuple(regclass), pgstatindex(text) — bloat analysis
·Optional: CREATE EXTENSION hypopg; — hypothetical validation of index advice
·The agent OS user must read postgresql.conf, pg_hba.conf and the log directory (add it to the postgres group)
Install and privilege details →

Frequently asked questions

A single role: GRANT pg_monitor TO clustereye, which covers pg_read_all_settings, pg_read_all_stats and pg_stat_scan_tables. Add CONNECT on each monitored database. All of it is read-only — ClusterEye writes nothing in baseline mode.

Start monitoring your PostgreSQL estate in five minutes.

One command to install. Talk to us if you have questions.

Book a live demoInstall and privilege details