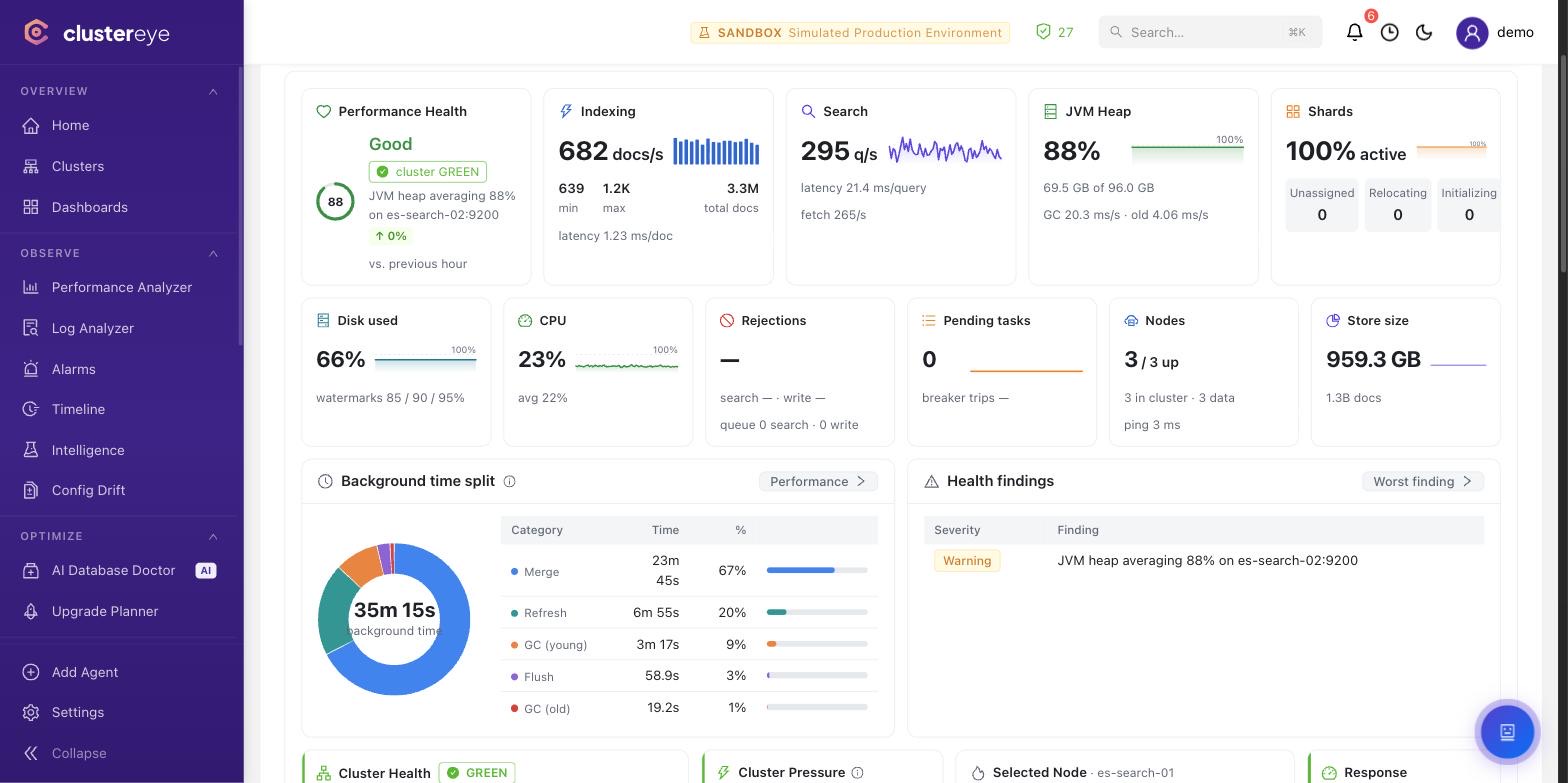
Which endpoints we read
_cluster/health — cluster status, unassigned shard count and rebalancing activity
_cluster/stats — node, index, document and storage totals
_nodes/stats — JVM heap, GC times, thread pool rejections, circuit breaker trips
_cat/indices and _cat/allocation — per-index size, document counts and disk distribution
<index>/_stats — indexing and search latency, refresh and merge statistics, down to shard level
POST _cluster/allocation/explain — why a shard is unassigned (read-only diagnostic)
_nodes/http — connection and HTTP layer state
What it does specifically for Elasticsearch
Shard and allocation diagnosis
Unassigned shards are explained through allocation/explain, naming the real cause — disk watermark, node filter, replica constraint.
Data lifecycle (ILM/tier) analysis
ILM policy progress and tier transitions are tracked, detecting indices stuck on a step, data left in the wrong tier and a hot tier that keeps growing.
JVM and pressure indicators
Heap usage, GC pauses, thread pool rejections and circuit breaker trips are tracked together so node pressure is caught early.
Index performance cockpit
Indexing and search latency broken down per index, surfacing the most expensive indices, refresh pressure and merge load.
Minimum privileges required
The baseline is read-only and safe to grant in production.
Prerequisites
·Endpoints used: _cluster/health, _cluster/stats, _nodes/stats, _nodes/http, _cat/indices, _cat/allocation, <index>/_stats, POST _cluster/allocation/explain.
·The built-in monitoring_user role is NOT sufficient (it lacks index-level monitor on arbitrary indices).
·manage, manage_ilm, manage_index_templates are not required. No settings writes, no reroute, no forcemerge.
·OpenSearch: an equivalent role with cluster_monitor + indices_monitor on *.