What we read
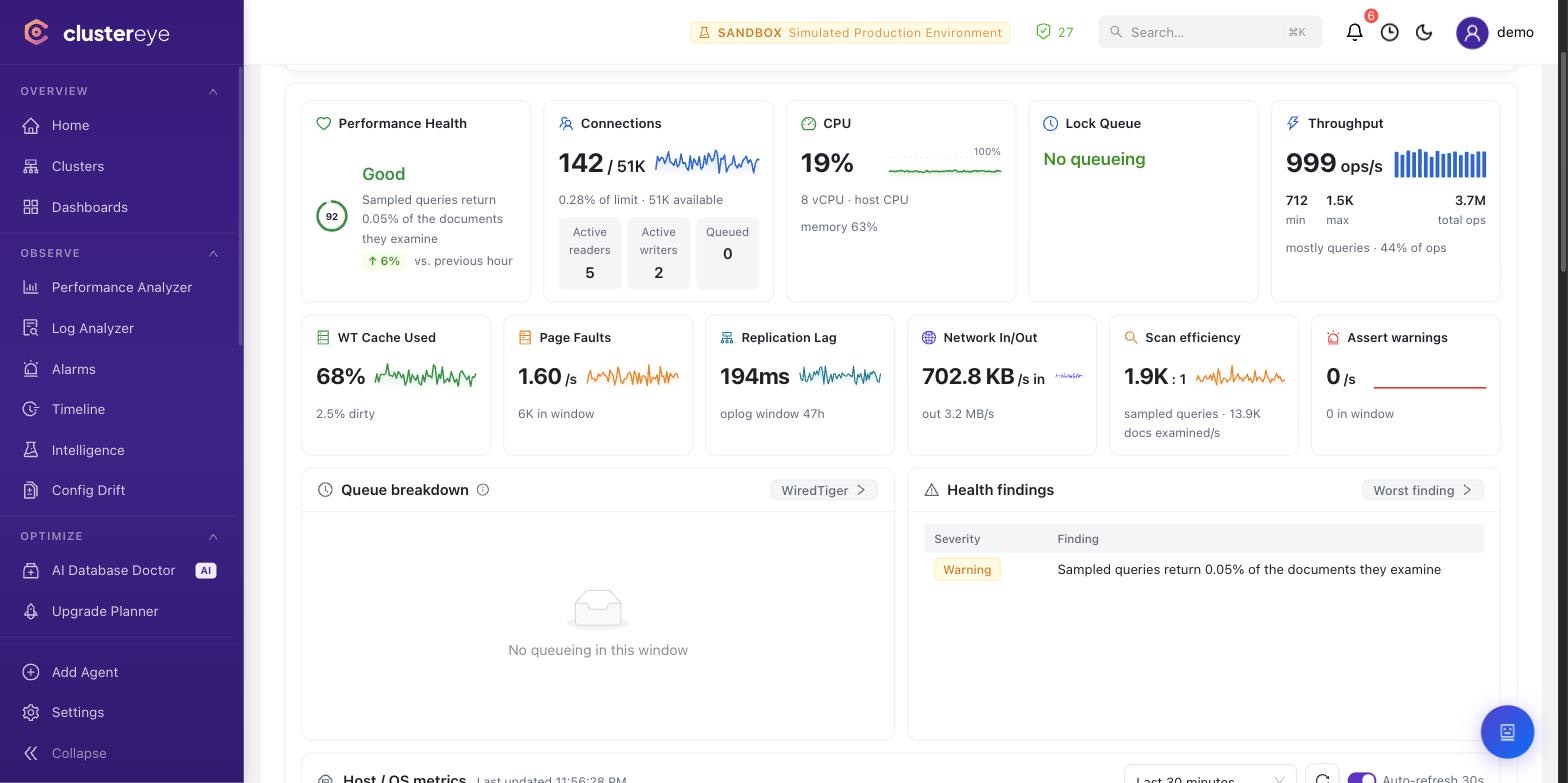
serverStatus — connections, opcounters, WiredTiger cache, lock and memory metrics
replSetGetStatus and replSetGetConfig — member roles, election history, oplog window and replication lag
currentOp — long-running operations, waiting and blocked work
$collStats and $indexStats — collection size, index usage and unused indexes
system.profile — slow query records (when you have profiling enabled)
the config database and balancerStatus — chunk distribution and balancer state on sharded clusters
dbStats, listDatabases, top — read/write distribution per database and collection
getCmdLineOpts, getParameter and mongod.conf — configuration drift
What it does specifically for MongoDB
Query Intelligence
Slow queries are grouped by fingerprint, prioritised, and given a cost and estimated saving. Patterns doing collection scans (COLLSCAN) and queries that have regressed are flagged separately.
Replica set and oplog visibility
Primary, secondary and arbiter roles on a live map; oplog window, replication lag and election events tracked historically.
Sharded cluster support
Connected through mongos, shards, chunk distribution, balancer activity and jumbo chunks become visible, with unbalanced shards surfaced.
Index usage analysis
$indexStats reveals never-used and overlapping indexes — the ones costing write throughput without helping any read.
Minimum privileges required
The baseline is read-only and safe to grant in production.
Prerequisites
·On sharded clusters point the agent at mongos; clusterMonitor already covers config database reads.
·The agent never changes the profiling level, never creates/drops indexes, never runs validate/compact — dbAdminAnyDatabase is not needed.
·OS: read access to the mongod log file and mongod.conf for log analysis and config drift.